|
|
Experimental design strategies
It is the purpose of experimental design to obtain a maximum of information with minimal time and financial investment. Experiments need to be planned by knowledgeable people who can:
1) formulate the problem and find the desired set of properties.
For example it may be desired to produce glass bottles in a factory with increased strength because of specific legal requirements.
2) identify all possible influences on those properties, including process parameters and the chemical glass composition.
The strength of glass bottles could be influenced by the chemical glass composition and the resulting transition temperature, the raw material suppliers, the kind and amount of cullet used, the process parameters, the experience, salary, and motivation of the personnel involved in the production, the day of production within a weeks work (e.g., weekend or workday), and many other influences.
3) select those influences that may be most significant and which are primary causes, without oversimplifying or overcomplicating the problem.
An experienced engineer may estimate that, for example, that the day of production does not influence the strength of glass bottles significantly, despite the different working atmosphere on weekends. On the other hand, the engineer may recognize the glass bottle annealing schedule and the transition temperature among the most important influences on the strength that must not be neglected. The transition temperature, however, may be deemed not to be a primary cause because it largely depends on the chemical glass composition. Therefore, the transition temperature as a possible variable could be replaced by the glass composition.
4) express the influences in numerical variables.
Most influences can be easily expressed in meaningful numbers, while qualities such as the experience of personnel should be simplified and categorized in levels like 1 (little experience) to 3 (much experience). Similarly, the type of raw material supplier may be categorized.
5) estimate the magnitude of expected effects, D, of those variables on the desired properties, if possible, from similar studies, and define the required and available measurement precision, s, for each technique used.
An estimation of the magnitude of the expected effects in relation to the measurement precision is important because if the variables are modified too little no effect will be observed. For instance, a change of the cooling rate during glass bottle annealing of 1oC/min may result in a strength change of 5-20%, which may be well measurable.
6) predict whether the expected effects of the variables are linear, independently of the values of the variables.
It could occur that a cooling rate change of 1oC/min is expected to influence the glass bottle strength for 5-20%, but at the same time a cooling rate change of 2oC/min is expected to influence the glass bottle strength for 20-50%, i.e., the effect of the cooling rate is probably not linear.
7) guess possible dependencies of variables on one another (variable interaction).
For example, it could be expected based on previous experience that a cooling rate change of 1oC/min influences the glass bottle strength much more or less than 5-20% if the percentage of cullet used for glass melting is modified, or if alumina is introduced in the glass not as feldspar but as hydroxide. The influence of cullet and alumina may be traced back to the glass composition as primary cause.
8) set practical upper and lower bounds on the variables, the desired properties, and also on the variable combinations if variable interactions exist.
Variables seldom can be modified completely arbitrarily. For example the cooling rate during glass bottle annealing can not exceed the limits of safe operation of the machine, and the chemical glass composition is subject to financial and environmental restrictions. It may also not be reasonable to investigate the strength of glass bottles below a certain limit where even careful handling leads to breakage. If variable interaction exist between the glass bottle cooling rate and the percentage of cullet used for glass melting (i.e., the glass composition) it is likely that the full range of all possible cooling rate - glass composition combinations should not be investigated because undesirably low strength data may result or technical or financial limitations exist.
9) apply experimental design matrix types accordingly.
The more information that can be gathered beforehand, the less intensive work will be required for the final experimental plan.
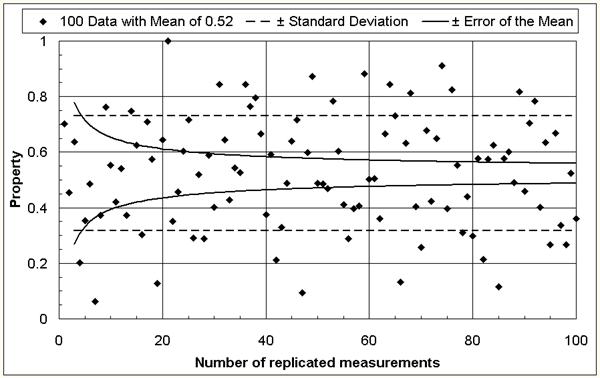
The mean of many measurements is more reliable than one single or a few measurements. In other words: the error of the mean decreases with increasing number of measurements [1] as depicted in Figure 1. Similarly, the effect of a variable is best determined by comparing means against means. When analyzing experimental findings, two types of errors are possible: an effect could be declared although there is none in fact (error type 1), or a real effect could go undetected (error type 2). To defend properly against both types of errors, one must run n = 16 · s2/D2 experiments at each variable level (= variable value) and use a statistical significance test to compare the mean of the results. For example, if it would be desirable to find out if a change in the glass composition decreases the annealing point for 10oC (D = 10) and the measurement precision is 5oC (s = 5), one would need to run 16 · 52 / 102 = 4 experiments with each of the two glass compositions and compare the mean of the results for statistical significance. If several variables need to be considered, the number of experiments required for a thorough investigation could thus become very large. A proper experimental design can reduce the effort significantly [1-6].
Figure 1: The reliability increases (the error of the mean decreases) with increasing number of replicated measurements.
An important issue in experimental design is the clear separation of the anticipated influences. For example, if the linear effects of MgO and CaO on a glass property should be investigated, one might design the two plans given in the table below. It is obvious that experiments following Plan 1 will not reveal the influences of MgO and CaO independently because as the MgO concentration increases, the CaO concentration decreases linearly; i.e., any observed property change might result from the MgO increase or the CaO decrease. On the other hand, in Plan 2, no such linear relation between the MgO and the CaO concentrations can be constructed as seen in Figure 2 below; therefore, their influences can be investigated independently - they are not correlated. Plan 2 represents a 22 (each variable at 2 levels, raised number: 2 variables total) factorial (more than one of the variables are modified simultaneously) design. If interactions between MgO and CaO or non-linear effects are expected, additional concentration levels should be incorporated in Plan 2 [1-6].
|
Variable correlation |
|
||
|
Plan 1 |
Plan 2 |
||
|
MgO in % |
CaO in % |
MgO in % |
CaO in % |
|
14 |
0 |
14 |
|
|
2 |
12 |
0 |
8 |
|
4 |
10 |
6 |
8 |
|
6 |
8 |
6 |
14 |
|
MgO and CaO correlated |
MgO and CaO not correlated |
||
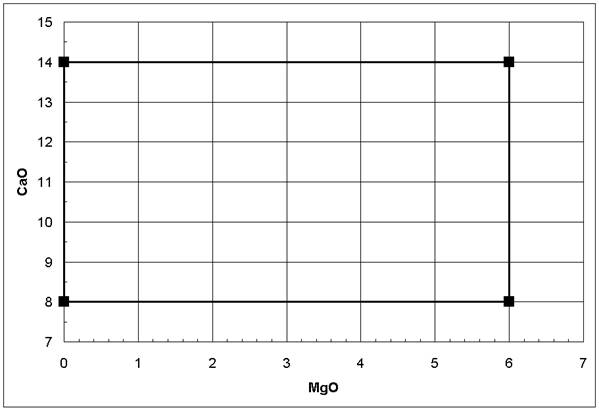
Figure 2: No linear correlation between MgO and CaO following a 22 factorial design (Plan 2 in table above)
References
[1] D. G. Montgomery: "Design and Analysis of Experiments", 6th Edition, John Wiley & Sons, 2005, ISBN: 0-471-48735-X.
[2] J. A. Cornell: "Experiments with Mixtures - Designs, Models and the Analysis of Mixture Data"; Wiley Series in Probability and Statistics; Wiley-Interscience; 3rd Edition, 2002, ISBN: 0-47139-367-3.
[3] H. M. Wadsworth: "Handbook of Statistical Methods for Engineers and Scientists"; McGraw-Hill, New York, 1990, ISBN 0-07-067674-7.
[4] G. F. Piepel, P. Hrma, J. D. Vienna: "Glass Chemistry Development Strategy for Hanford High Level Waste (HLW)", in Science and Technology for Disposal of Radioactive Tank Wastes, 1998, p 393-402, Plenum Press, New York.
[5] G. F. Piepel, J. A. Cornell: "Mixture Experiment Approaches: Examples, Discussions, and Recommendations"; Journal of Quality Technology (1994), vol. 26, no. 3, p 177-196.
[6] Ch. D. Hendrix: "What every technologist should know about experimental design"; Chemtech (1979), vol. 9, no. 3, p 167-174.